成本分析报告
The Fleet app allows for analysis on total vehicle costs, including both contract costs and service and repair charges. Data can be adjusted to view total costs by vehicle or driver. Additionally, costs can be compared with the previous year, quarter, or month, to view changes in fleet costs over time.
总成本
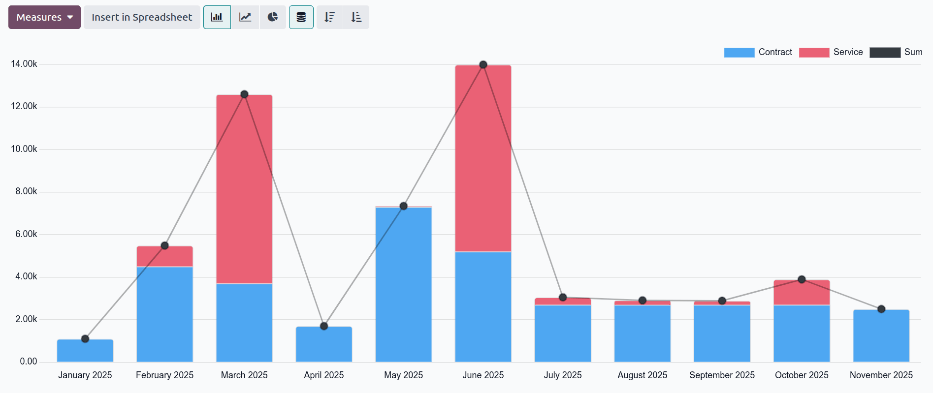
要查看 成本分析报告 ,请导航至 。默认报告显示当前年的每月服务成本和合同成本图表。
Example
In this report, it is possible to determine that June had the highest total costs, with almost $14,000 dollars in contract and repair costs, while January had the lowest costs, with less than $2,000 of contract costs and no repairs.
成本-按车辆
某些公司希望按车辆查看成本,而不是按月。这允许车辆管理器确定哪些车辆在路上花费最多,以帮助进行未来的购买和维修决策。
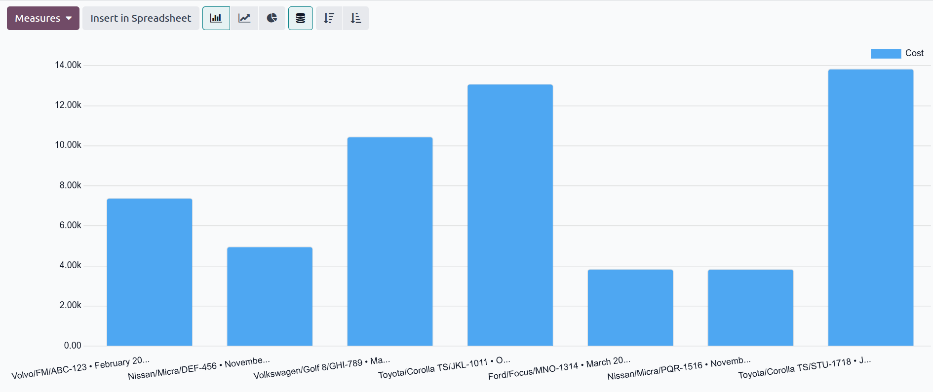
打开默认的 成本分析报告 。然后,点击搜索栏,并点击 车辆 下的 分组 列。
Example
From this report, it can be determined the Toyota Corolla with the license plate STU-1718
cost the most, with almost $14,000 in costs for the year. Additionally, the both Nissan Micro
vehicles and the Ford Focus cost the least, with under $5,000 in total costs each.
成本-按司机
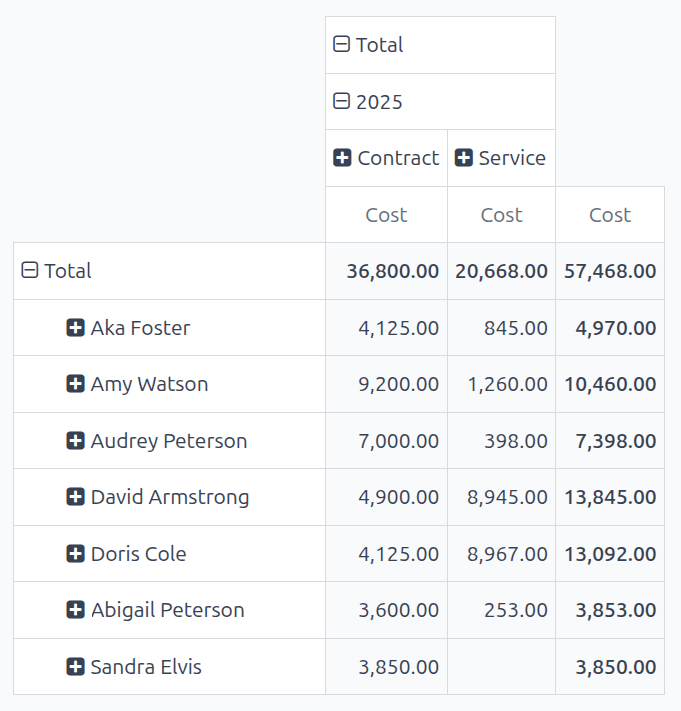
打开默认的 成本分析报告 。然后,点击搜索栏,并点击 司机 下的 分组 列。 最后,点击 (透视) 图标。
报告现在显示了数据库中的每个司机的 合同 和 服务 成本的总和。这允许车辆管理器查看Which drivers incur the most repair costs。
Example
这表明 Sandra Elvis 没有 incurred any service costs for the year, while both Doris Cole 和 David Armstrong incurred almost $9,000 in repairs. 虽然 这不能解释这两个司机why incurred the most costs, 但这可能允许车辆管理器 调查服务记录 Those two drivers,以确定为什么 在该年 there were such high costs。
详细比较
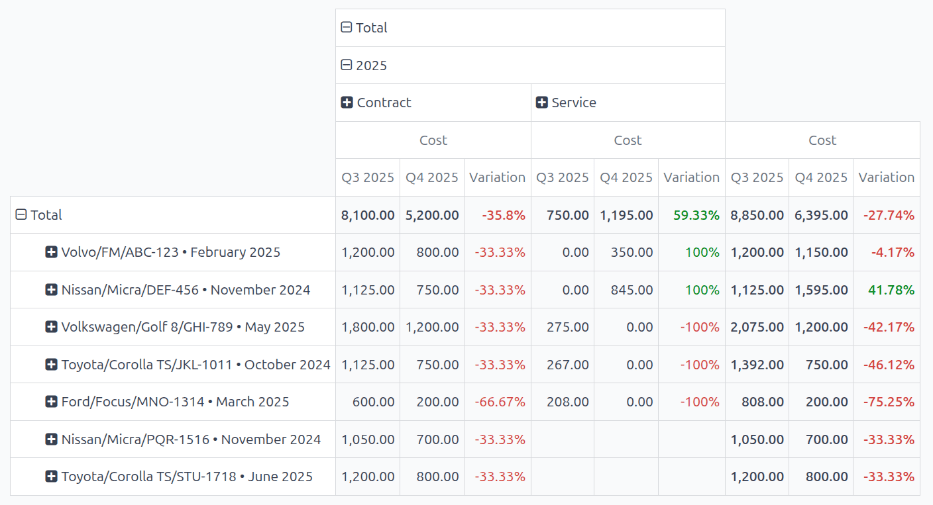
打开默认的 成本分析报告 ,然后点击 (透视) 图标。然后,点击搜索栏,并点击 Q4 列中的 过滤器 ,然后点击 Date: Previous Period 列中的 比较 。
报告现在显示了每辆车的 合同 和 服务 成本的详细信息,并带有一个 变化 列,显示当前年和第三第四季度成本之间的变化。
Example
这表明 Ford Focus 的成本变化最大的是 Nissan Micro,其车牌号为 DEF-456 ,因为 Nissan Micro 的总成本增加了41.78%。