采购和供应商分析仪表板
Odoo 仪表板中的 采购和供应商分析 仪表板,参考:doc:仪表板 <../../../productivity/dashboards> 模块,提供了 several 评估采购绩效和供应商可靠性的指标。
仪表板跟踪财务数据,如总采购金额和平均采购金额,以及采购订单数。它还提供了供应商性能的 KPI,如平均收货时间和按时收货的百分比。这使得能够对供应商进行排名,并相应地优化采购策略。
要访问 采购和供应商分析 仪表板,请转到仪表板应用程序,然后,在左侧面板中,导航至 物流 部分,并单击仪表板名称。仪表板在主视图中打开。
更多内容
Note
Odoo 仪表板的访问 权限 基于用户组,并在仪表板应用程序中管理。默认情况下, 采购和供应商分析 仪表板仅对具有 库存 应用程序管理员访问权限的用户可见,且只能由该用户访问。
导航仪表板
Tip
默认情况下,此仪表板显示所有时间数据。要显示特定时间段的数据,请单击仪表板顶部的 所有时间 并选择或定义适当的时间段。
要获得更精确的评估,请通过搜索栏按供应商进行过滤。
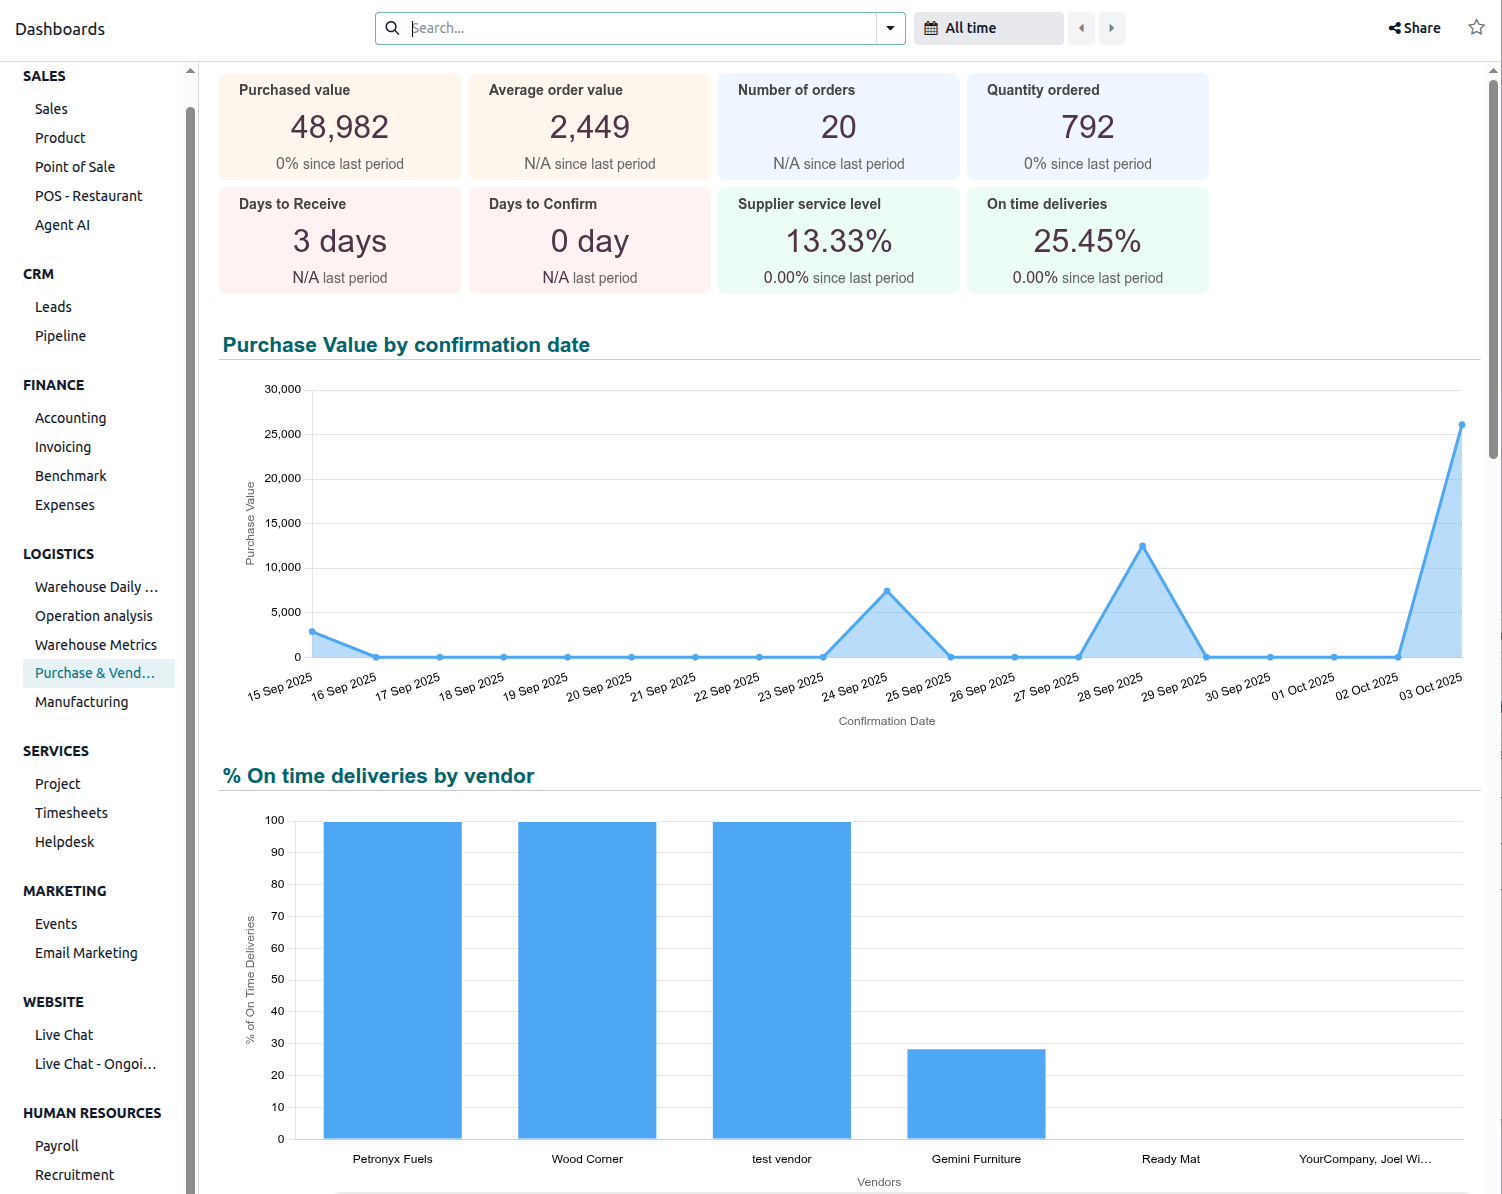
Eight cards at the top of the dashboard show the following information:
Purchased value: indicates the total value of purchases during the selected period.
Average order value: indicates the average purchase amount per order during the selected period.
Number of orders: indicates the number of purchase orders during the selected period.
Quantity ordered: indicates the quantity of products ordered during the selected period.
Days to receive: indicates the average number of days between the order and receipt of purchased products (i.e., between the order deadline of the purchase order and the expected arrival of the purchase order line).
Note
The expected arrival date is not impacted by a change to the scheduled date on the receipt.
Days to Confirm: indicates the average number of days before a purchase order is confirmed (i.e., between the creation date of the RFQ and the confirmation date of the purchase order).
Supplier service level: indicates the quantity received versus the quantity purchased, as a percentage.
Note
This KPI is impacted by purchases with future expected receipts.
On time deliveries: indicates the percentage of products received on time (based on the expected arrival date on purchase order lines)
可用的图表有:
Purchase Value by confirmation date: shows the total value of confirmed purchases by date.
% On time deliveries by vendor: shows the percentage of products received on time, by vendor (based on expected arrival on purchase order lines.)
Top vendors by amount: shows the ranking of vendors by total value of purchase orders and number of purchase orders.
Top vendors by lead time in days: shows the average number of days required to receive purchased products, by vendor (Order deadline purchase order - Expected arrival purchase order line).
Note
The expected arrival date is not impacted by a change to the scheduled date on the receipt.
Average product purchased cost by confirmation week: shows the average unit cost of products purchased, by week in which the purchase order is confirmed.
Top purchase orders by value: lists the ten purchase orders with the highest total value, in descending order.
Top 10 late receipts: lists the ten receipts with the longest delay after the expected receipt date.
Top purchased products: lists the ten products with the highest total purchase amount, in descending order.
Supplier Dependency Chart: shows the percentage of purchases by buyer.